How to Start a Screen Repair Business
How to start a phone and screen repair business: skills and training, tools and parts, sourcing quality screens, pricing, warranties, marketing and safety.

Work out what your business screens cost to run: a display energy calculator, typical power draw, what drives consumption, energy labels and ways to cut costs.
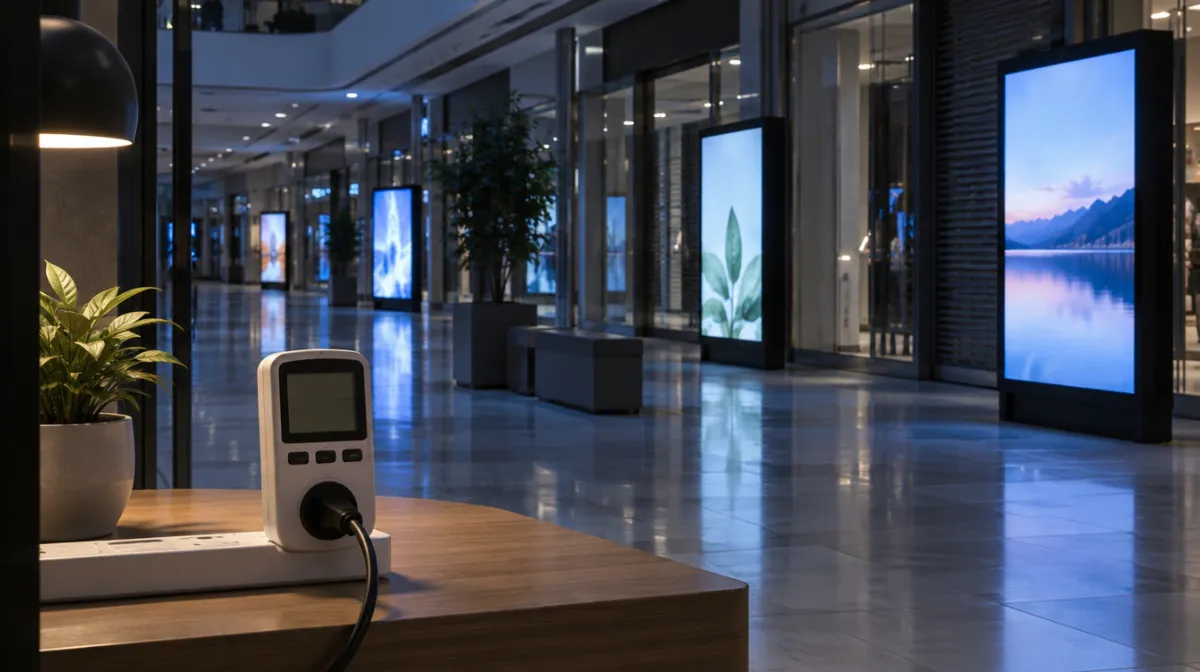
Business displays run for long hours, so their electricity use adds up, especially across many sites. The calculation is simple: energy in kilowatt-hours (kWh) = power in watts × hours on ÷ 1,000, and cost is that figure multiplied by your electricity price. A typical indoor signage screen might draw somewhere around 100 to 200 watts, but a high-brightness window display or an LED wall can use far more. The calculator below works out the annual cost for any number of screens using your own figures.
Use the typical power figure from your display’s spec sheet or energy label, and your own electricity price. Currency follows whatever price you enter.
Enter your figures.
With the default figures, a 150-watt screen on 12 hours a day, every day, uses about 659 kWh a year, which costs about 165 at a price of 0.25 per kWh.
If you’d like a refresher on how watts, energy and time connect, our sister site explains how power, energy and time relate.
| Factor | Effect |
|---|---|
| Brightness | The biggest factor; high-brightness window displays (often 2,500 nits or more) can draw several times more than standard indoor screens |
| Screen size | Larger panels need more backlight power |
| Hours of operation | Doubling hours doubles energy use |
| Technology | LED backlights are far more efficient than older CCFL models; LED walls vary with pitch and brightness |
| Content | On OLED and LED walls, darker content uses less power; on most LCDs it makes little difference |
| Standby | Usually small per screen, but it adds up across large networks |
| Media player | Small players often use a few watts to tens of watts; PCs use more |
A cheaper screen that draws more power can cost more overall. Over five years at 12 hours a day, a screen drawing 200 watts uses about 4,380 kWh, while one drawing 120 watts uses about 2,628 kWh. At 0.25 per kWh, that’s a difference of about 438 per screen, which can outweigh a small difference in purchase price, especially across a network. Use typical power figures from spec sheets and your own tariff to compare models before you buy.
Ten stores each run two 55-inch menu boards at 120 watts for 14 hours a day, seven days a week. That’s 20 screens × 120 W × 5,110 hours ÷ 1,000 = about 12,264 kWh a year. At 0.25 per kWh, that’s roughly 3,066 a year. Switching each screen off two hours earlier saves about 1,752 kWh, or around 438 a year, before any cooling savings. Factor running costs into your digital signage ROI and your digital menu board setup.
It depends on size, brightness and hours. Many indoor screens draw roughly 100 to 200 watts when on, while high-brightness and outdoor screens use much more. Check the spec sheet or measure with an energy meter.
Yes, a lot. Brightness is usually the single biggest factor in a display’s power consumption, so lowering it where possible saves energy.
Multiply the power in watts by the hours it’s on, divide by 1,000 to get kWh, then multiply by your price per kWh. The calculator above does this for you, including standby.
Turning them off when nobody is watching saves energy, and modern commercial displays are designed to be scheduled on and off daily.

Every article is edited by a human and checked against our editorial policy. Spotted a mistake? Tell us.
How to start a phone and screen repair business: skills and training, tools and parts, sourcing quality screens, pricing, warranties, marketing and safety.
How to measure digital signage ROI: setting goals, baseline metrics, sales lift and A/B tests, cost savings, proof of play and calculating payback period.
LCD, OLED and Mini-LED compared for business use: brightness, contrast, burn-in risk, lifespan and cost, with picks for signage, offices and retail.